Microsoft Excel: Data Analysis With Excel Pivot Tables By 365 Academy
Published 12/2025
MP4 | Video: h264, 1280x720 | Audio: AAC, 44.1 KHz, 2 Ch
Language: English | Duration: 1h 20m | Size: 944 MB
Master Excel Pivot Tables for data analysis, EDA & business intelligence.
What you'll learn
Learn how to use Pivot Tables and Pivot Charts to streamline and simplify your workflow in Excel
Take your data analysis & EDA skills from ZERO to PRO with Excel Pivot Tables
Master unique Pivot Table tips, tools and case studies
Learn how to use Pivot Tables and Pivot Charts to streamline and simplify your workflow in Excel
Requirements
Basic experience with Excel is a plus
Description
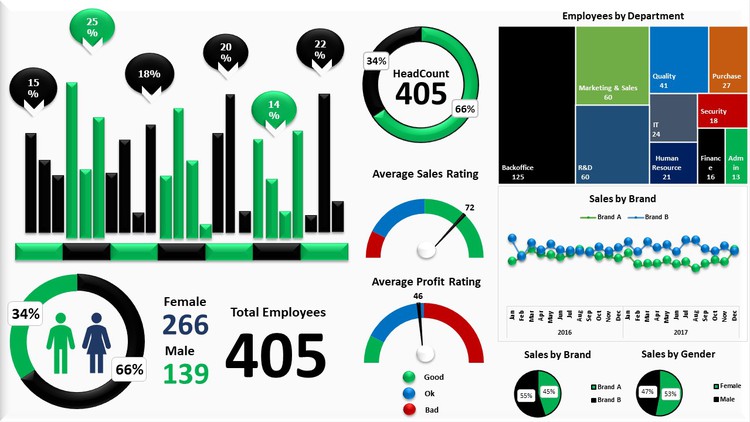
Excel Pivot Tables are one of the most powerful tools available for data analysis and business intelligence.They allow you to slice, summarize, and explore raw data in seconds-revealing trends, patterns, and insights that would otherwise stay hidden. Simply put, Pivot Tables help you find answers fast.Whether you're evaluating product sales by region, comparing marketing campaign performance, or analyzing housing price trends over time, Pivot Tables enable you to uncover meaningful insights with speed and accuracy.This course gives you a complete, hands-on mastery of Excel Pivot Tables and Pivot Charts. You'll learn exactly when, why, and how to use them effectively. Step by step, you'll explore advanced filtering, formatting, sorting, calculations, and interactive visualization techniques through clear demonstrations and practical exercises.We begin with the fundamentals and quickly build to advanced analytical features, covering:Structuring raw data for analysisPivot Table layouts and customizationFormatting and design techniquesSorting, filtering, and grouping toolsCalculated fields, items, and valuesPivot Charts, slicers, and timelinesBuilding interactive dashboards in ExcelWe'll kick things off by exploring each of the 20+ charts & graphs in Excel, including:Bar & Column chartsHistograms & Pareto charts (Office 365, Excel 2016 or Excel 2019)Line charts, Area charts & trend linesPies & DonutsScatter plots & Bubble chartsand much more.Whether you're brand new to Pivot Tables, expanding your Excel toolkit, or aiming to level up your analytics career, this course is packed with practical knowledge and real-world applications.In today's data-driven world, professionals who can turn data into insight stand out. Enroll now and take the next step toward becoming an Excel data analysis expert.
Who this course is for
ANYONE who works with Excel on a regular basis (even if you've never used a Pivot Table!)
Microsoft Excel users who have basic skills but would like to become more proficient in data exploration and analytics
Anyone looking to pursue a career in data analysis, analytics or business intelligence
Microsoft Excel users who want to become more proficient in data exploration and analytics